
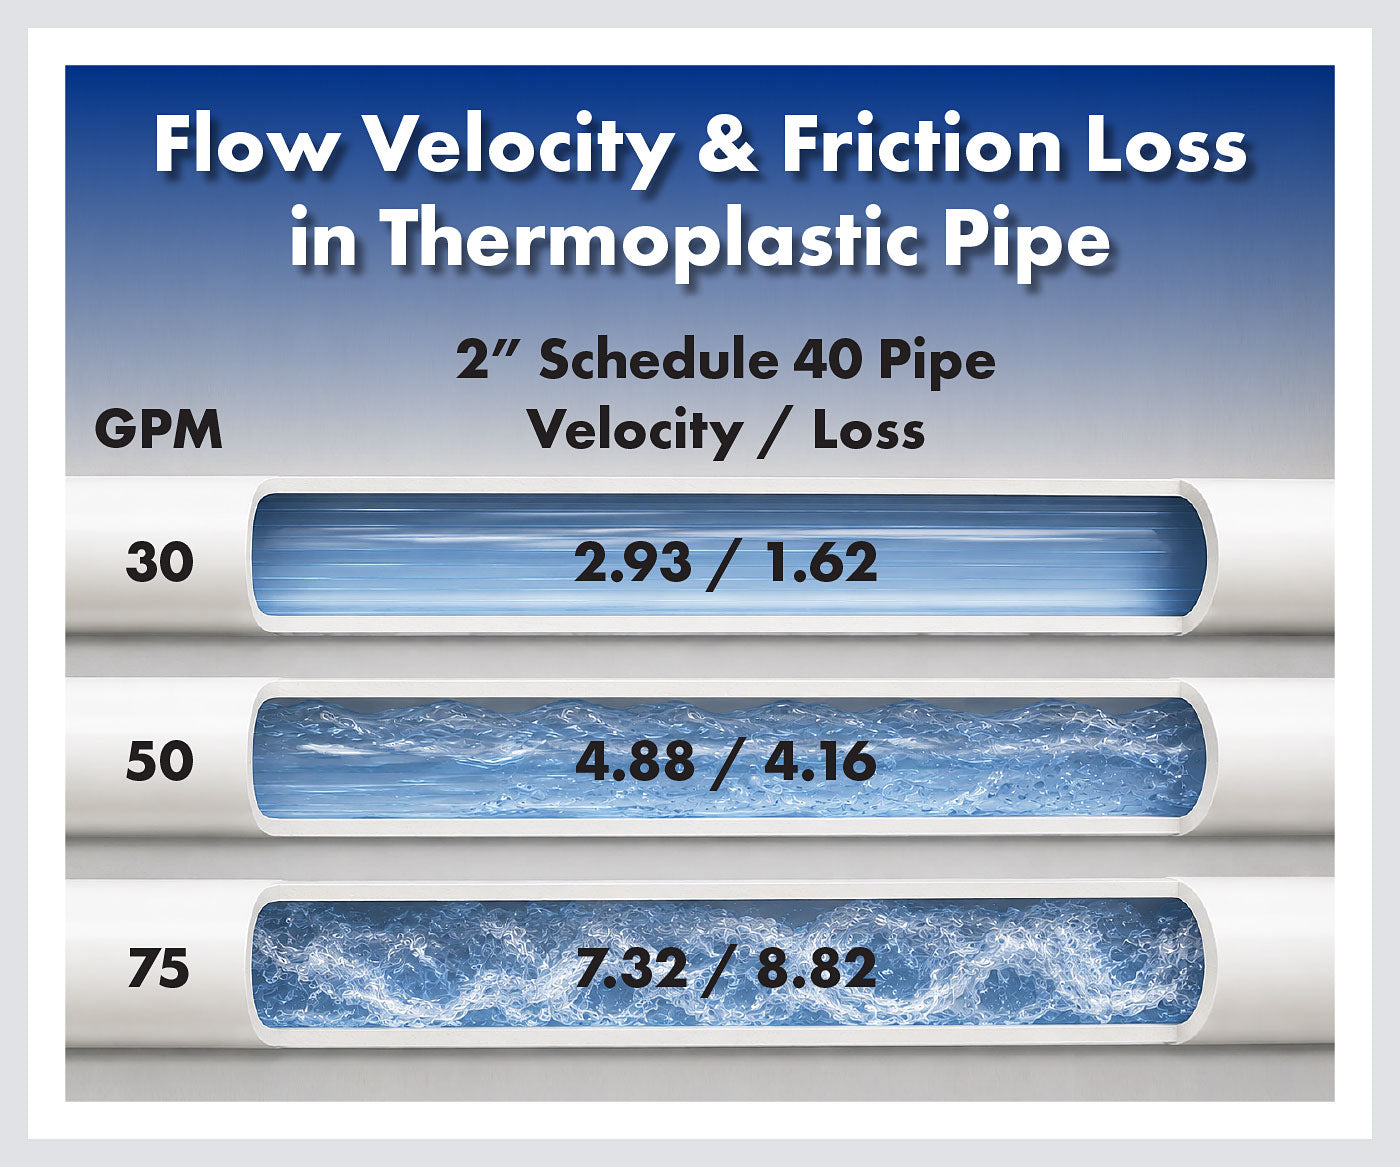
When designing a fluid handling system, two values will define how well your pipe is sized and how efficiently your pump operates: flow velocity and friction loss. Get either one wrong and you end up with undersized pipe that costs you in pump energy, premature wear, or system pressure that falls short where you need it most.
This guide explains what these values mean, how to read them for Schedule 40 and Schedule 80 thermoplastic pipe, and how fitting losses stack up on top of straight-pipe losses in real-world PVC and CPVC systems. For the complete reference tables covering pipe sizes and flow rates, download the two-page chart at the bottom of this post.
Two Numbers That Define Every Piping System
Flow Velocity (Feet Per Second)
Velocity is how fast the fluid is moving through the pipe, measured in feet per second. It depends on two things: the flow rate in gallons per minute and the inside diameter of the pipe. A smaller pipe carrying the same GPM as a larger pipe will always produce a higher velocity.
Velocity matters because it directly affects system longevity. High velocity in thermoplastic pipe creates turbulence that erodes fitting walls over time, generates noise and vibration, and can produce water hammer when flow is stopped abruptly. The generally accepted guideline is to keep velocity at or below 5 feet per second for most applications. For pipe 6 inches and larger, this limit is especially important.
Friction Loss (Feet of Head Per 100 Feet of Pipe)
Friction loss is the pressure consumed simply by pushing fluid through a length of pipe. It is expressed as feet of water head per 100 feet of pipe, which converts to PSI by dividing by 2.31. Every foot of pipe, every change in direction, and every valve in the system contributes to total friction loss that the pump must overcome.
Friction loss grows sharply as velocity increases. Doubling the flow rate through the same pipe does not double the friction loss. It increases it by roughly four times. This is why upsizing pipe is often the most cost-effective way to improve system performance.
Key Relationship
Friction loss scales with the square of velocity. Push twice the GPM through the same pipe and expect roughly four times the friction loss. Upsizing pipe by one nominal size often cuts friction loss in half or more at the same flow rate.
Schedule 40 vs. Schedule 80: Why the Numbers Differ
Schedule 40 and Schedule 80 pipe share the same outside diameter for any given nominal size. The difference is wall thickness. Schedule 80 has a thicker wall, which means a smaller inside diameter. That smaller bore produces higher velocity and higher friction loss at any given flow rate compared to the same nominal size in Schedule 40.
This does not make Schedule 80 the wrong choice. Its heavier wall delivers significantly higher pressure ratings and greater impact resistance, making it the correct selection for many chemical processing, industrial, and high-temperature applications. The point is that when you specify Schedule 80, you need to account for the higher friction losses in your system design, or consider upsizing the pipe diameter to compensate.
Illustrative Comparison: Schedule 40 vs. Schedule 80
The tables below show velocity (ft/sec) and friction loss (ft of head per 100 ft of pipe) for four common pipe sizes at a range of typical flow rates. For the complete reference tables covering pipe sizes and flow rates, download the Alsco Industrial reference charts at the bottom of this post.
1-Inch Pipe
| GPM | Schedule 40 | Schedule 80 | ||
|---|---|---|---|---|
| Velocity (ft/sec) | Loss (ft/100 ft) | Velocity (ft/sec) | Loss (ft/100 ft) | |
| 2 | 0.77 | 0.55 | 0.94 | 0.88 |
| 5 | 1.93 | 1.72 | 2.34 | 2.75 |
| 7 | 2.72 | 3.17 | 3.28 | 5.04 |
| 10 | 3.86 | 6.02 | 4.68 | 9.61 |
| 15 | 5.79 | 12.77 | 7.01 | 20.36 |
1" Schedule 40 exceeds the 5 ft/sec velocity guideline between 10 and 15 GPM. Schedule 80 approaches that threshold at 10 GPM. For sustained flow rates above 10 GPM, step up to 1-1/4" or larger.
1-1/2-Inch Pipe
| GPM | Schedule 40 | Schedule 80 | ||
|---|---|---|---|---|
| Velocity (ft/sec) | Loss (ft/100 ft) | Velocity (ft/sec) | Loss (ft/100 ft) | |
| 10 | 1.62 | 0.72 | 1.88 | 1.04 |
| 20 | 3.23 | 2.61 | 3.75 | 3.75 |
| 30 | 4.85 | 5.53 | 5.63 | 7.95 |
| 40 | 6.47 | 9.43 | 7.50 | 13.55 |
| 50 | 8.08 | 14.25 | 9.38 | 20.48 |
1-1/2" pipe handles 20 GPM comfortably in both schedules. By 30 GPM, Schedule 80 nudges past the 5 ft/sec guideline. At 40 GPM and above, velocity climbs steeply in both schedules. Step up to 2" for sustained flow rates above 30 GPM.
2-Inch Pipe
| GPM | Schedule 40 | Schedule 80 | ||
|---|---|---|---|---|
| Velocity (ft/sec) | Loss (ft/100 ft) | Velocity (ft/sec) | Loss (ft/100 ft) | |
| 20 | 1.95 | 0.76 | 2.23 | 1.06 |
| 30 | 2.93 | 1.62 | 3.35 | 2.25 |
| 50 | 4.88 | 4.16 | 5.58 | 5.79 |
| 75 | 7.32 | 8.82 | 8.38 | 12.27 |
| 100 | 9.75 | 15.03 | 11.17 | 20.90 |
2" Schedule 40 handles 50 GPM right at the velocity guideline. The same flow in Schedule 80 pushes past it. At 75 GPM and above in 2" pipe, friction loss climbs steeply in both schedules. Step up to 2-1/2" or 3" for these flow rates.
3-Inch Pipe
| GPM | Schedule 40 | Schedule 80 | ||
|---|---|---|---|---|
| Velocity (ft/sec) | Loss (ft/100 ft) | Velocity (ft/sec) | Loss (ft/100 ft) | |
| 30 | 1.33 | 0.23 | 1.49 | 0.31 |
| 50 | 2.21 | 0.60 | 2.49 | 0.81 |
| 75 | 3.31 | 1.28 | 3.74 | 1.72 |
| 100 | 4.42 | 2.18 | 4.98 | 2.93 |
| 150 | 6.63 | 4.63 | 7.47 | 6.20 |
3" pipe handles up to 100 GPM well within the velocity guideline in both schedules. At 150 GPM, velocity exceeds 5 ft/sec in both. Consider 4" pipe for sustained flow rates above 125 GPM.
Friction Loss Through Fittings
Straight pipe friction loss is only part of the picture. Every fitting adds resistance that must be calculated. The standard method expresses fitting resistance as equivalent feet of straight pipe. A 90-degree elbow in a 2" line adds the same friction loss as 5.7 additional feet of straight pipe. In a system with multiple elbows and tee branches, that adds up quickly.
| Fitting | 1" | 1-1/2" | 2" | 2-1/2" | 3" | 4" | 6" |
|---|---|---|---|---|---|---|---|
| Tee Run | 1.7 | 2.7 | 4.0 | 4.9 | 6.1 | 7.9 | 12.3 |
| Tee Branch | 6.0 | 8.4 | 12.0 | 14.7 | 16.4 | 22.0 | 32.7 |
| 90 Elbow | 2.5 | 4.0 | 5.7 | 6.9 | 7.9 | 11.4 | 16.7 |
| 45 Elbow | 1.4 | 2.1 | 2.6 | 3.1 | 4.0 | 5.1 | 8.0 |
Values in equivalent feet of straight run pipe. Add total equivalent footage for all fittings to actual pipe length, then apply the friction loss rate from the reference charts.
Real-World Example
A 100-foot run of 2" Schedule 40 pipe at 50 GPM has a friction loss rate of 4.16 ft per 100 ft, so 4.16 ft for the straight run alone. Add four 90-degree elbows (4 x 5.7 = 22.8 ft) and two tee branches (2 x 12.0 = 24.0 ft) and the system equivalent footage becomes 100 + 22.8 + 24.0 = 146.8 ft. Total friction loss: 146.8 / 100 x 4.16 = approximately 6.1 ft of head. The fittings added nearly 50 percent on top of the straight-pipe loss.
Practical Takeaways for System Design
- Keep flow velocity below 5 ft/sec in standard service. Exceed this and you accelerate fitting erosion, increase noise, and risk water hammer.
- Schedule 80 pipe of the same nominal size as Schedule 40 will produce higher velocity and higher friction loss due to its reduced inside diameter. Account for this when selecting pipe or adjust by upsizing.
- To convert friction loss from feet of head to PSI, divide by 2.31.
- Fittings can represent 30 to 50 percent or more of total system friction loss in systems with multiple direction changes. Always calculate them, not just the straight pipe run.
- If a pump is underperforming, check whether the pipe is undersized before assuming the pump is at fault. Upsizing one pipe diameter often costs less than a larger pump and delivers better long-term results.
Download the Full Reference Charts
The complete Schedule 40 and Schedule 80 friction loss and flow velocity tables from Alsco Industrial are available as a two-page PDF. All pipe sizes from 1/2" through 12" and flow rates from 1 to 2,500 GPM are included.
Download Friction Loss Reference Charts (PDF)
Disclaimer of Liability
This information is provided based on present knowledge and is believed to be accurate. Alsco Industrial makes no guarantees regarding its completeness or suitability for any specific application. Final determination of product and system suitability is the sole responsibility of the user. Contact our Technical Sales Department with any questions concerning your specific application.
ONE SOURCE. TOTAL CONFIDENCE.
Alsco Industrial has been helping engineers, contractors, and plant maintenance teams design and specify thermoplastic fluid handling systems since 1983. Whether you are working with Schedule 40 PVC in an agricultural application or Schedule 80 CPVC in a chemical processing environment, we carry the pipe, fittings, valves, and pumps to build a complete system.
Contact our team at 888-941-3030 or sales@alscoind.com to discuss your application.